Laboratory Information Bulletin (LIB) 4306: Chloramphenicol Residues in Shrimp and Crab Tissues
Determination of Chloramphenicol Residues in Shrimp and Crab Tissues by Electrospray Triple Quadrupole LC/MS/MS
Volume 19, No. 6, June 2003
Joe Storey, Al Pfenning, Sherri Turnipseed, Gene Nandrea, Rebecca Lee, Cathy Burns, Mark Madson
Denver District Laboratory and
Animal Drugs Research Center
Food and Drug Administration
P.O. Box 25087, Denver CO 80225-0087
The Laboratory Information Bulletin is a tool for the rapid dissemination of laboratory methods (or information) which appear to work. It may not report completed scientific work. The user must assure him/herself by appropriate validation procedures that LIB methods and techniques are reliable and accurate for his/her intended use. Reference to any commercial materials, equipment, or process does not in any way constitute approval, endorsement, or recommendation by the Food and Drug Administration.
Abstract
This LIB describes a solid phase extraction and cleanup procedure for the determination of chloramphenicol residues in shrimp and crab. Chloramphenicol is detected, after chromatographic separation, using a Thermo Electron TSQ Quantum triple quadrupole mass spectrometer with an ESI source operating in negative ion mode. An internal standard is used to correct for variability of extraction and instrument response. Four product ions of chloramphenicol and one product ion of the internal standard are monitored using selected reaction monitoring (SRM). Chloramphenicol can be quantitated and confirmed at the 0.1ppb level.
Introduction
Recently it has been reported that the antibiotic chloramphenicol (CAP) has been found in several imported foodstuffs from Asia, including shrimp, crab and crayfish. Initially, several confirmatory analytical LC/MS/MS methods for chloramphenicol using ion trap detection were developed by the Denver District Animal Drugs Research Center (ADRC) of FDA to address this problem. Specifically, LIBs 4284, 4287, 4294, 4281 (1-4) describe methods developed to qualitatively confirm CAP in shrimp, crayfish, crab, and honey, respectively, at 1ppb or higher. Using these methods over the last year, several FDA laboratories have positively confirmed the presence of CAP in many import samples of the aforementioned foods. These methods employ negative ion mode with electrospray ionization. In these methods full scan MS2 spectra were obtained not only from the parent CAP ion (m/z=321), but also from the corresponding m/z =323 ion M+2 (35Cl, 37Cl) isotope. The ion trap full scan data gave excellent positive identification but was not quite as successful for precise quantitation or sensitive enough to detect sub-ppb CAP levels. It was requested that a more sensitive confirmatory method for CAP be developed for use in the field.
To gain this added sensitivity, typically a triple quadrupole LC/MS/MS operating in Selected Reaction Monitoring or SRM mode is used. In SRM, instead of monitoring the entire mass spectrum of the product ions of a parent ion, only a few selected product ions are monitored. Seattle District Laboratory has recently developed a triple quadrupole Finnigan TSQ 7000 LC/MS/MS method (5) for the analysis of CAP in shrimp (LIB 4290) which seems to work well with a LOQ of 0.3ppb and a LOD of 0.08ppb. However, our newer model triple quadrupole instrument (a TSQ Quantum, also using negative ion mode ESI LC/MS/MS) gave appreciable downward drift in response to chloramphenicol after many injections during a run sequence, possibly due to ion suppression. Another FDA laboratory (verbal communication) has also experienced a similar effect operating in negative ion mode. For this reason we would not be able to use the Seattle method without an internal standard.
This LIB describes an additional method for the LC/MS/MS detection of chloramphenicol in shrimp and crab. Differences between our method and the Seattle method include:
- An internal standard (IS), meta-Chloramphenicol or m-CAP, is added at the beginning of the extraction in our method. The use of an internal standard self-corrects for any extraction variability from sample to sample and should also self -correct for any drift in detector response during a run. With the use of an IS, 0.1ppb CAP levels in tissue can be reliably quantitated.
- The extraction employed in our method does not use separatory funnels but uses disposable glassware to minimize the possibility of cross-contamination.
- A mobile phase of only acetonitrile and water without any salt buffers is used in our method which should help minimize MS maintenance.
Overview of method
The extraction used in the method described in this LIB is a simplified version of that described in LIB 4284. Ten grams of tissue composite (with added m-CAP internal standard) is extracted (3x) in ammoniated ethyl acetate. The combined extracts are evaporated and re-dissolved in water. A hexane wash removes fats. The extract is then applied to a reverse-phase SPE column and the CAP is eluted with methanol. The methanol is evaporated to dryness and the extract is reconstituted in water, filtered and injected into the LC/MS for analysis. The m/z 321 [M-H] ion for both CAP and the internal standard m-CAP is isolated in Q1, with five product ions isolated in Q3. Confirmation of CAP is made by comparison of ion chromatogram peaks with those of a CAP standard. Quantitation of CAP is made by taking the ratio of the CAP base peak area (m/z 152) to the internal standard m-CAP base peak area (m/z 207). This MS approach is an adaptation (as per a manuscript kindly provided to Denver Laboratory by FDA's Center for Veterinary Medicine) of a Canadian method (6). The Canadian method's HPLC column with a modified mobile phase is used in this LIB. Also we found that by adding the internal standard m-CAP at the beginning of the extraction instead of at the end increased the reproducibility of the method. Finally, we also used a higher level of internal standard (0.3ppb) to give a more intense response.
Internal Standard preparation: (fortification solution preparation is in italics).
The internal standard used is m-chloramphenicol (m-CAP), was custom synthesized for the FDA.
- A 100µg/mL stock standard m-CAP solution in acetonitrile (acn) is prepared.
- A 1:100 dilution in acn of the stock standard gives an intermediate standard concentration of 1µg/mL or 1000ng/mL m-CAP.
- Three mL of the intermediate standard is diluted to 500mL with water to give a m-CAP concentration of 6ng/mL diluent solution (This diluent solution is used to prepare the LC/MS standards).
- Five mL of the intermediate standard is diluted to 250mL with water to give the m-CAP fortification solution of 20ng/mL. Every 10.0g sample is fortified with 150µL of m-CAP fortification solution for a 0.3ppb IS (internal standard) concentration--this is equivalent to a 6ng/mL final vial concentration of m-CAP.
Chloramphenicol std preparation: (preparation of fortification solutions in italics).
Chloramphenicol standard used is the current USP lot.
- A 100µg/mL stock standard CAP solution in acetonitrile (acn) is prepared.
- A 1:100 dilution with m-CAP diluent of the stock standard gives an intermediate standard concentration of 1µg/mL or 1000ng/mL CAP.
- A 1:10 dilution of the intermediate CAP standard with m-CAP diluent gives a 100ng/mL CAP concentration standard equivalent to a 5ppb CAP standard.
- A 6:10 and 4:10 dilution of the 5ppb CAP standard with m-cap diluent gives 3ppb and 2ppb standards respectively. A 5.00mL to 25.00mL dilution with m-cap diluent gives a 1ppb CAP standard.
- A 6.00, 3.00, 1.00, and 0.00 mL dilution of the 1ppb CAP standard to 10.00mL with m-CAP diluent gives 0.6, 0.3, 0.1, and 0ppb CAP standards respectively. The 1.0, 0.6, 0.3 and 0.1ppb CAP standards will have CAP concentrations of 20, 12, 6, and 2ng/mL respectively. The 0.3ppb standard can be used as the CCV solution. A similar, but prepared with a different CAP stock solution, 0.1ppb ICV CAP standard (but using the same diluent solution) is also prepared.
- Preparation of CAP fortification solutions. (These solutions do not have m-cap diluent in them but are diluted with water). Using the 100ug/mL CAP stock solution above a 1:100 dilution is made with water; 1.00mL of this solution is diluted to 10mL with water to give CAP fortification solution #1 of 100ng/mL concentration. A 2:10 dilution of fortification solution #1 gives fortification solution #2 of 20ng CAP/mL in water. For 10.0g tissue, prepare a 0.1ppb spike by adding 50µL of fortification solution #2. Prepare a 0.3ppb spike by adding 30µL of fortification solution #1. Prepare a 0.6ppb spike by adding 60µL of fortification solution #1 and so on.
Sample preparation
- Place peeled (if applicable) tissue in blender, and blend with dry ice using robot coupe mixer with pulsed action until contents are uniform (7).
- Accurately weigh (to the nearest tenth of a gram) 10.0g of blended meat composite into a 50 mL polypropylene (P/P) centrifuge tube. Fortify as described in the standard preparation section.
- Add 20 mL of extraction solution (EtOAC:NH4OH, 98:2) homogenize with vortexer until the entire mass is broken up (about 30 sec). Mix on pulsed Multitube Vortexer for 10 minutes.
- Centrifuge for 7 min @ 4000 rpm, decant into another 50mL polypropylene centrifuge tube and place in N-Evap set at 50oC to begin evaporation under nitrogen.
- Repeat extraction steps 3and 4 two more times, combining the extracts.
- Finish evaporating to dryness under nitrogen.
- Add 30mL of 0.05% acetic acid in H2O to dried extract, vortex ca. 1 min to loosen residue then continue to vortex a minimum of 5 min.
- Add 10 mL of hexane to the 50mL tube, and cap. Invert tube gently several times so that emulsions do not form but ensure any solids are dissolved, centrifuge 3 min at 4000 rpm. Aspirate with disposable pipette and discard hexane layer. Repeat hexane de-fatting step twice more with two additional 5mL portions of hexane and on the final wash remove any surface lipid-like material at interface between the hexane and water.
- Condition each C18 SPE column with 3 mL MeOH followed by 3 mL H2O. Transfer aqueous extract to a conditioned SPE system consisting of a C18 SPE column on bottom, with a 70 mL reservoir on top. The reservoir should have a Varian disposable filter on the bottom. With a vacuum manifold, allow flow through at about 1 drop/sec. Apply positive pressure if necessary for clogged units. Remove the 70mL reservoir.
- Wash with 2mL water. Allow cartridges to run dry and pull vacuum for about 2min. Elute the C18 SPE with two, 2 mL MeOH volumes into a 15mL disposable P/P centrifuge tube. Evaporate MeOH eluate to dryness in an automatic TurboVap under nitrogen with water-bath set at 50°C.
- The dried extracts are reconstituted into 0.5mL water by vortexing for 5 min to dissolve residue, and syringe-filtered through an Acrodisc membrane for injection into LC-MS system.
Equipment and Reagents
- LC: ThermoQuest Surveyor MS Pump and autosampler.
- MS: ThermoQuest Finnigan TSQ Quantum with ESI source with metal sample tube.
- Instrument software: Xcalibur Version 1.3.
- LC column: Waters brand Xterra C18, 3.5um, 2.1 x 150mm with guard column 2.1 x 10mm of same material.
- Robot Coupe model RSI BX4V (Scientific Industrial Division).
- Multitube pulsing vortex shaker with cartridges to vortex 15mL and 50mL polypropylene tubes. (Cole-Parmer cat. no. a-51601-00).
- N-EVAP: Organomation N-EVAP Analytical Evaporator.
- Gelman Laboratory Acrodisc LC 13mm Syringe filter with 0.45um PVDF membrane PN 4452T.
- SPE columns: C18 Varian Bond Elut 6cc/500mg.
- HPLC grade or pesticide grade solvents-acetonitrile, ethyl acetate, ammonium hydroxide (30% as NH3), Glacial acetic acid.
- Varian 1-1/16" 20um disposable filter, p/n 12131024.
- Acrodisc 13mm 0.45um PVDF membrane (Gelman PN 4452T).
- Disposable 1mL syringe (Becton Dickinson part no 309602).
- TurboVap LV evaporator (Zymark part no. 48110) with associated tube racks.
Instrument Operating Parameters
- Perform instrument verification check using polytyrosine (prepared as per instrument manual and containing tyrosine, as well as the trimer and the hexamer of tyrosine) to verify correct mass axis, sensitivity of Q1, resolution, and MS2 product ion collision energy and sensitivity.
- A standard mixture should be analyzed initially to determine the retention times of CAP and m-CAP. The retention time should be within ± 5% of what was observed for standards previously (unless column or mobile phase have been changed). It may require one or two injections of standard for retention times to stabilize if instrument has not been used recently.
- The response for 75 µL injection of a 0.1 ppb standard (2ng/mL) for CAP should have a S/N>200:1 for the 321-> 152 MS2 transition.
- Typical MS fore pump pressure (torr) for our TSQ were 0.98 to 1. Typical ion gauge pressure (torr) is around 8e-6.
- ESI source probe angle=60°
- Note: The tune file for CAP was obtained by syringe infusion of a 10ng/µL chloramphenicol in water standard and adding LC flow (200µL/min 35% acn, 65% water mobile phase) through a tee. By doing this one of the parameters optimized was the spray voltage which gave an optimal value (for 321 response) of 4kV. A metal sample tube (50µm high flow size) instead of a fused silica tube was installed in the TSQ. (A metal sample tube is less susceptible to attack from acetonitrile). Practical operation of the instrument revealed, however, that in negative ion mode the MS began to give, with successive injections, too high of a spray current (up to 60µamps) when the LC flow was diverted to the MS during a run. To lower arcing, a lower spray voltage of 1500V was chosen. This greatly lowered the spray current and did not seem to adversely affect 321 sensitivity significantly. The MS/MS was also optimized for CAP: specifically the MS2 SRM responses of the CAP 321 parent ion (176, 194, 257, 152) were optimized for their respective collision energies. And similarly, the MS/MS was also optimized for m-CAP 207 product ion.
Spray voltage=1500V
Sheath gas pressure=29
Aux gas pressure=18
Capillary temperature=350°C
Tube lens offset=70
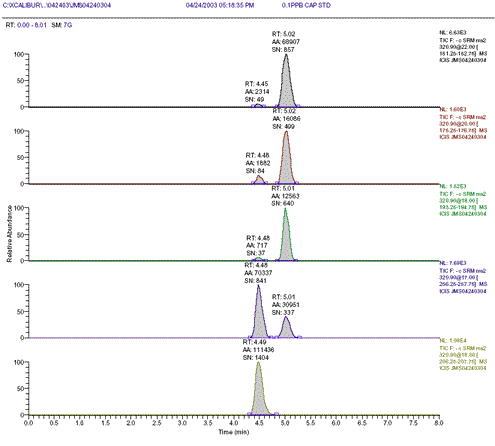
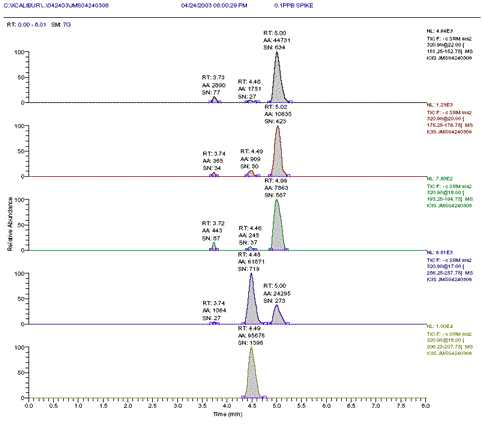
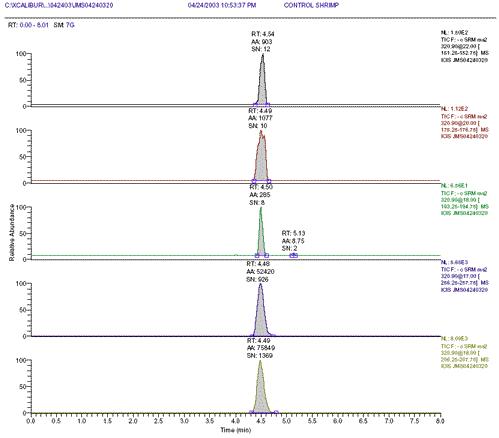
Collision pressure (argon)=1.5torr - Typical operating pressures of a new column with guard (see equipment and reagents section) using initial LC parameters is about 2200psi. and m-CAP typically elutes at 4.5min, CAP at 5 min (see Figs. 1-3). Also, although m-CAP and CAP elute when the LC mobile phase is 35% acetonitrile, for some dirtier matrices a further column rinse gradient up to 90% acetonitrile was needed (see LC gradient table below).
TSQ Quantum Instrument Method
MS Editor Page (Segments & Scan Events) note: CE=collision energy, scan time in sec
- Acquire Time (min) : 8.00
- Number of Segments: 1
- Segment:1.
- Segment Time (min): 8.00
- Chrom Filter: Unused
- Q2 Collision Gas Pressure(mTorr) : 1.50
- Tune Method: C:\Xcalibur\methods\CAP\captsq021303 .TSQTune
- Number of Scan Events: 5
- Scan Event: 1.
- Polarity: Negative.
- Data Type: Centroid.
- Scan Type: SRM Table
- SRM Table 1 Row(s)
Parent Product Width Time CE Q1 PW Q3 PW Tube Lens 320.900 152.000 1.500 0.20 22 0.90 0.90 Tune Value - Source CID: Unused
- Scan Event: 2.
- Polarity:Negative.
- Data Type: Centroid.
- Scan Type: SRM Table
- SRM Table 1 Row(s)
Parent Product Width Time CE Q1 PW Q3 PW Tube Lens 320.900 176.000 1.500 0.20 20 0.90 0.90 Tune Value - Source CID: Unused
- Scan Event: 3.
- Polarity: Negative.
- Data Type: Centroid.
- Scan Type: SRM Table
- SRM Table 1 Row(s)
Parent Product Width Time CE Q1 PW Q3 PW Tube Lens 320.900 194.000 1.500 0.20 18 0.90 0.90 Tune Value - Source CID: Unused
- Scan Event: 4.
- Polarity:Negative.
- Data Type: Centroid.
- Scan Type: SRM Table
- SRM Table 1 Row(s)
Parent Product Width Time CE Q1 PW Q3 PW Tube Lens 320.900 257.000 1.500 0.20 17 0.90 0.90 Tune Value - Source CID: Unused
- Scan Event: 5. (note: the 207 SRM is from the m-cap or internal standard.)
- Polarity:Negative.
- Data Type: Centroid.
- Scan Type: SRM Table
- SRM Table 1 Row(s)
Parent Product Width Time CE Q1 PW Q3 PW Tube Lens 320.900 207.000 1.500 0.20 18 0.90 0.90 Tune Value - Source CID: Unused
Divert Valve Page number of valve positions = 3
| Divert Time (min) | Valve State |
|---|---|
| 0.00 | Inject \ Waste |
| 4.00 | Load \ Detector |
| 5.50 | Inject \ Waste |
Surveyor Auto sampler Method:
Wash Bottle: methanol
Injection volume (uL) 75.00
Flush volume (uL) : 2000
Flush/wash source is bottle.
Needle height from bottom(mm) : 0.200
Wash volume (uL) : 2000
Flush speed (uL/s) : 250.000
Post-Injection Valve switch time (min) : 0.000
Syringe speed (ul/s) : 8.000
Injection mode is partial loop
Tray temp control is on. Temp(C): 5.000
Column oven control is on. Temp(C) : 30.000
General:
Solvent A name: Water
Solvent B name:
Solvent C name:
Solvent D name: Acetonitrile Column name:
Min. Pressure, bar: 10
Max. Pressure, bar: 400
Pumping Efficiency, %: 100
Fractionations/Filling Stroke: 1
Use custom stability limits: No
| No. | Time, min | Flow, ul/min | A, % | B, % | C, % | D, % |
|---|---|---|---|---|---|---|
| 1 | 0.00 | 200 | 65 | 0 | 0 | 35 |
| 2 | 6.00 | 200 | 65 | 0 | 0 | 35 |
| 3 | 6.50 | 200 | 10 | 0 | 0 | 90 |
| 4 | 13.50 | 200 | 10 | 0 | 0 | 90 |
| 5 | 14.00 | 200 | 65 | 0 | 0 | 35 |
| 6 | 20.00 | 200 | 65 | 0 | 0 | 35 |
Data Interpretation/Reporting
The [M-H-] (m/z321) ion for both CAP and the internal standard m-CAP is isolated (after LC separation) in Q1 with five product ions isolated in Q3.
Specifically:
| Product ion m/z | Ion |
|---|---|
| CAP | |
| 257 | [M-CO, HCl]- |
| 194 | [M-H- Cl2HCCONH2]- |
| 176 | [194-water]- |
| 152 | [O2N-C6H4-CHOH]- (used as CAP base peak) |
| m-CAP | |
| 257 | [M-CO, HCl]- |
| 207 | [257-CH3Cl and rearrangement]- (m-CAP base peak) |
For positive CAP confirmation, the CAP MS2 ions of 152, 176, 194, and 257 should all be present at the same retention time (within 5%) as that of standard CAP. These ions should each be present with area abundances of at least one-half the abundance of the 0.1ppb CAP spike. The m-CAP should be present in all samples and the 207 m-CAP SRM should be present at the same retention time (within 5%) as compared to that of standard m-cap for positive confirmation of the internal standard.
Using the collision energies as specified in the instrument SRM table, the CAP MS2 product ions have the following average peak area ratios for multiple injections of CAP standards (normalized to the 152 ion as 100%).
| m/z 257 |
m/z 194 |
m/z 176 |
|---|---|---|
| 48% | 20% | 23% |
As part of the confirmation criteria for CAP, any presumptive CAP tissue positive must have similar ion abundance ratios to the average of the CAP standards (within 10% absolute difference). CAP tissue spikes in our laboratory typically gave % RSD's of <5% for ion peak area ratios.
For CAP quantitation, use m/z 321>152 peak area for CAP response and m/z 321>207 peak area for m-CAP response. Construct a calibration curve using all standards (including the zero standard) using the ratio of [(CAP 152)/(m-CAP 207)] responses vs. CAP concentration in ng/mL. Determine the concentration of the sample extract from the calibration curve. Calculate the corresponding tissue concentration by: (assuming an initial 10g tissue portion, and a final vial (extract) volume of 0.5mL)
[ng/g × (10g/0.5mL)]=ng/mL or [ ppb × 20] = ng/mL, or
Tissue ppb=[extract conc. in ng/mL]/20
Results and Discussion
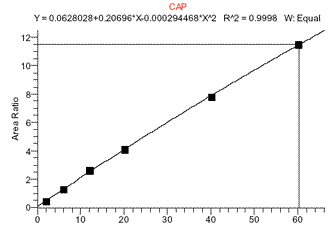
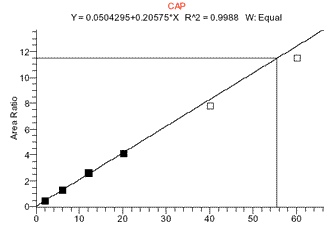
The MS response to chloramphenicol was found to have a limited linear range. To quantitate at levels around 0.1ppb, a linear standard curve from 0 to 1ppb can be used (such curves gave correlation coefficients (r) of >0.995). However, to quantitate at both low and high (>1ppb CAP) levels a quadratic fit curve over a range of 0 to 5ppb was sometimes found to work better. Although a linear fit curve from 0-5ppb CAP might still have a r value of >0.995, using this curve often would adversely affect quantitation at low levels of 0.1ppb. (See figs 4 and 5).
Using an internal standard, repeat injections of a CAP standard (or CCV standard) should easily give values of <25% difference from the initial value. Similarly, an injection of an independently made CAP standard (or ICV standard) should also easily give an agreement within 25% of the CCV CAP standard. A 0.1ppb CAP standard (2ng/mL CAP) gave an average signal-to-noise ratio (S/N) of 800:1 for SRM 152 and an average S/N ratio of 1400:1 for SRM 207 (m-CAP internal standard at 6ng/mL or 0.3ppb m-CAP-see Fig. 1).
Quantitation of 0.1ppb CAP levels allows the 3:1 compositing of individual tissue subs to be done and still ensures that a 0.3ppb quantitation level be maintained in any individual sub. (A 3-sub composite could have one sub containing 0.3ppb CAP blended (composited) with two subs containing no chloramphenicol and the composite would still be confirmed for CAP). See table 1 for recovery data of chloramphenicol in shrimp and crab.
Safety
- Standard laboratory safety practices (lab coats, eye protection) should be followed.
- In addition any safety precautions listed in the determinative SOP for preparation of reagents should be followed.
- Also follow instrument manufacturer's guidelines for safe operation of electrospray LC/MS (particularly with respect to high voltages, high current, and high temperatures).
Figure 1 : 0.1ppb or 2ng/mL CAP std with 6ng/mL internal standard m-CAP
Plot of MS2 ions m/z 152, 176, 194, 257 and 207 (m-CAP).
Figure 2: 0.1ppb CAP shrimp spike with internal standard m-CAP spiked at 0.3ppb (equiv. to 6ng/mL m-CAP)
Figure 3: Control shrimp blank spiked with 0.3ppb internal standard m-CAP
Figure 4. CAP standard curve from 0-3ppb CAP (0-60ng/mL) showing quadratic fit
| Cap concentration in ng/mL |
Figure 5. CAP standard curve over smaller range of 0-1ppb CAP showing linear fit
| Cap concentration in ng/mL |
| Spike level (ppb) | Number of spikes (n) | Tissue matrix | Avg. % recovery | RSD (%) |
|---|---|---|---|---|
| 0.05 | 3 | Shrimp | 87 | 4 |
| 0.1 | 11 | Shrimp | 89 | 25 |
| 0.2 | 3 | Shrimp | 99 | 16 |
| 0.3 | 12 | Shrimp | 101 | 14 |
| 0.6 | 7 | Shrimp | 95 | 9 |
| 2 | 1 | Shrimp | 95 | na |
| 0.05 | 3 | Crab | 76 | 4 |
| 0.1 | 5 | Crab | 106 | 23 |
| 0.2 | 6 | Crab | 100 | 28 |
| 0.3 | 6 | Crab | 101 | 17 |
| 1 | 3 | Crab | 92 | 6 |
| 2 | 3 | Crab | 97 | 2 |
References
- A. Pfenning, S. Turnipseed, J. Roybal, C, Burns, M. Madson, J. Storey and R. Lee, "Confirmation of Multiple Phenicol Residues in Shrimp by Electrospray LC/MS" (2002) Laboratory Information Bulletin 4284 13 pages.
- S. Turnipseed, C, Burns, J. Storey, R. Lee, and A. Pfenning, "Confirmation of Multiple Phenicol Residues in Honey by Electrospray LC/MS" (2002) Laboratory Information Bulletin 4281 12 pages.
- A. Pfenning, S. Turnipseed, J. Roybal, C, Burns, M. Madson, J. Storey and R. Lee, "Confirmation of Multiple Phenicol Residues in Crab by Electrospray LC/MS" (2002) Laboratory Information Bulletin 4294 12 pages.
- A. Pfenning, S. Turnipseed, J. Roybal, C. Burns, M. Madson, J. Storey and R. Lee, "Confirmation of Multiple Phenicol Residues in Crawfish by Electrospray LC/MS" (2002) Laboratory Information Bulletin 4289 12 pages.
- B. Neuhaus, J. Hurlbut, and W. Hammack, "LC/MS/MS Analysis of Chloramphenicol in Shrimp" (2003) Laboratory Information Bulletin 4290 18 pages
- Quon, et. al, "Chloramphenicol Residues in Honey", (2002), Canadian Food Inspection Agency, Calgary Food Laboratory, Additives and Chemical Contaminants Analytical Methods Manual, Method ACC-062-V1.0, Volume 5.
- E. Bunch, D. Altwein, L. Johnson, J. Farley and A. Hammersmith, (1995), J. AOAC Int. 78 (3) 883-887.


