

Laboratory Information Bulletin (LIB) 4423: Melamine and Related Compounds
GC-MS Screen for the Presence of Melamine, Ammeline, Ammelide, and Cyanuric Acid
Volume 24, October 2008
Jonathan J. Litzau1*, Gregory E. Mercer2*, Kevin J. Mulligan1*
1Forensic Chemistry Center (FCC), Food and Drug Administration, 6751 Steger Drive, Cincinnati, OH 45237
2Pacific Regional Laboratory Northwest (PRLNW), Food and Drug Administration, 22201 23rd Drive SE, Bothell, WA 98021
* E-mail: jonathan.litzau@fda.hhs.gov; greg.mercer@fda.hhs.gov
The Laboratory Information Bulletin is a tool for the rapid dissemination of laboratory methods (or information) which appears to work. It may not report complete scientific work. The user must assure himself/herself by appropriate validation procedures that LIB methods and techniques are reliable and accurate for his/her intended use. Reference to any commercial materials, equipment, or process does not in any way constitute approval, endorsement, or recommendation by the Food and Drug Administration.
Appendix 1 should be used for human food and food ingredient testing.
Abstract
This procedure was initially developed by PRLNW and FCC to screen for the presence of melamine and some related compounds at a minimum reporting level (MRL) of 10 µg/g and above in a variety of matrices using gas chromatography/mass spectrometry. Samples are extracted using a mixture of acetonitrile/water/diethylamine and the analytes are subsequently converted to trimethylsilyl derivatives for analysis. When a sample is positive for one or more of the target analytes at the MRL or above, a semi-quantitative estimate of the amount present in the sample can be obtained. This procedure has been evaluated using dry protein materials (wheat gluten, rice protein, corn gluten, and soy protein), wet and dry pet foods, and dry animal feeds. It has been shown subsequently that the method is applicable to a variety of other matrices. Additional guidance is provided to extend the MRL to 2.5 µg/g in Appendix 1. In the event of a negative finding, it is a requirement of the procedure that the performance of the method has been verified at the time of use. This is accomplished by fortifying a representative sample with the analytes at the minimum reporting level and observing them upon analysis.
Introduction
In March 2007, the Forensic Chemistry Center (FCC) was asked to assist in the investigation of pet foods responsible for adverse effects in cats and dogs. While initial reports implicated a number of potential agents, the unambiguous identification of melamine in pet foods prompted the largest number of product recalls in FDA history. The product recalls resulted in a large-scale surge of samples of pet food and related matrices that required analytical testing.
Melamine was first identified in samples of "cuts and gravy" type pet foods. Later, the source of the contamination was traced to "protein components" of these products, specifically wheat gluten and rice protein imported from China. The earliest methods were designed to detect melamine only as a marker of contamination and were qualitative in nature. Additional characterization of the adulterated protein raw materials led to the discovery of at least three other compounds in significant amounts: ammeline, ammelide, and cyanuric acid. Melamine and these newly identified, related compounds became the target analytes for development of the rapid screening method reported herein (1).
The target compounds presented several analytical challenges. Ammeline and ammelide exhibit extremely low solubility in traditional extraction solvents. Due to these solubility limitations, a novel solvent system based on diethylamine (DEA) was introduced by PRLNW to provide adequate extraction and dissolution of all four compounds from a variety of matrices. In addition, melamine-cyanurate crystals were present in the protein concentrates. Melamine in the presence of cyanuric acid can undergo self-assembly to form supramolecular aggregates via hydrogen bonding (2). This melamine-cyanurate complex is very insoluble in most solvents. This complexation phenomenon was demonstrated (using the initial version of the method) during melamine fortification experiments on rice protein samples with very high levels of cyanuric acid. Recovery results from these experiments were typically less than 10% due to the formation and insolubility of the melamine-cyanurate complex. This phenomenon has also been assigned as the probable cause for the apparently exaggerated toxicity of melamine in the pet food. Affected animals suffered from kidney failure with acute tubular necrosis in the kidney and the presence of intratubular crystals (3). These crystals were predominantly composed of melamine-cyanurate. The addition of DEA to the solvent system allowed dissolution of not only all four target analytes, but also disrupted the hydrogen-bonded melamine-cyanurate complex so that the total amount of adulteration could be determined semi-quantitatively.
Finally, the chromatographic behavior of these compounds is poor on conventional GC columns. The formation of trimethylsilyl derivatives was found to dramatically enhance their chromatographic properties and provide specific mass spectra of the compounds of interest. Semi-quantitative results were achieved using external calibration and the incorporation of an internal standard was used as a monitor for the proper performance of the derivatization reaction as well as a means of correcting for variation in sample/injection volumes during splitless injection. A minimum reporting level of 10 µg/g of each target analyte was established. This has subsequently been reduced to 2.5 µg/g and should be demonstrated with all different sample matrices.
Experimental
Equipment and Supplies:
- Agilent 5975i GC-MS system equipped with a 30 m Agilent DB5-MS capillary column (or equivalent) or other mass spectrometer system.
- Laboratory Centrifuge capable of applying 5000 g to 50 mL centrifuge tubes.
- Pierce Reacti-therm / Reacti-Vap Sample Preparation System or other device suitable for evaporating solutions to dryness.
- 50-mL polypropylene centrifuge tubes with screw caps.
Reagents and Standards:
- Diethylamine (DEA), SigmaUltra, Sigma Chemical Co.
- Pyridine, Certified A.C.S. Reagent, Fisher Scientific
- Extraction Solvent: 10 / 40 / 50 : DEA / Water / Acetonitrile
Prepare a solution which consists of 10 parts (by volume) diethylamine, 40 parts water and 50 parts acetonitrile. Store in the dark. The solution turns yellow with time. - Silylating Reagent: BSTFA with 1% TMCS: bis(trimethylsilyl)trifluoroacetamide with 1% Trimethylchlorosilane (e.g. Sylon BFT, Supelco)
- 2,6-Diamino-4-chloropyrimidine, CAS 156-83-2, 98%: Cat. C33204-5G, Aldrich
For use as an internal standard. Prepare a stock solution at 1.0 mg/mL in pyridine. For adding to sample extracts, dilute the stock solution in pyridine to a concentration of 5.0 µg/mL. - Melamine, CAS 108-78-1, Cat. 240818-5G, Aldrich
Prepare a stock solution of 1.0 mg/mL in a mixture of 20 / 80 : DEA / H2O (v/v) - Ammelide, CAS 645-93-2, Cat. A0645, TCI America
Prepare a stock solution of 1.0 mg/mL in a mixture of 20 / 80 : DEA / H2O (v/v) Brief sonication may be required to solubilize this standard. - Ammeline, CAS 645-92-1, Cat. A0676, TCI America
Prepare a stock solution of 1.0 mg/mL in a mixture of 20 / 80 : DEA / H2O (v/v) A modest amount of sonication may be required to solubilize this standard. - Cyanuric Acid, CAS 108-80-5, Cat. C0459, TCI America
Prepare a stock solution of 1.0 mg/mL in a mixture of 20 / 80 : DEA / H2O (v/v)
Store stock solutions of standards in the refrigerator to retard hydrolysis. It has not been established how rapidly the solutions degrade but the potential does exist. Stock standards have sat on the benchtop at room temperature for three weeks and shown no evidence of degradation.
QC Elements:
A 1:1 (v/v) mixture of Sylon BFT and pyridine should be run at the onset of each analysis and then occasionally throughout the analysis to show that there is no carryover.
A method blank which consists of 20 mL of extraction solvent taken through the entire procedure including the addition of the internal standard should be evaluated to make sure that there is no contamination from the reagents, the nylon filter or the containers.
Condition the system at the beginning of each sample set by making two injections of the high standard (see below). These injections will not be used for semi-quantitation.
A low standard, which consists of each analyte at 0.10 µg/mL, should be analyzed at the beginning of the sample set to show that the necessary sensitivity is being attained by the instrument.
A high standard at 1.0 µg/mL of each analyte is analyzed at the beginning of the sequence and after all samples in the batch have been injected to provide a basis for semi-quantitative evaluation and to demonstrate whether the amount of drift during the analysis of the set of samples is tolerable.
sample which is representative of the type of samples which are being analyzed is fortified with each analyte (viz. melamine, ammelide, ammeline and cyanuric acid) at a level of 10 µg/g. Analysis of this spiked control sample must indicate that the compounds are present which serves to demonstrate effective system performance at the desired reporting level. See Sample Fortification, below.
Procedure:
This procedure should be used with the GC operating in the splitless mode for greater sensitivity.
A. Extraction Procedure
Weigh out approximately 0.5 g of a representative portion of the sample into a 50mL polypropylene centrifuge tube.
Add 20 mL of extraction solvent (10:40:50 DEA : H2O : Acetonitrile).
Mix well to thoroughly wet the entire sample.
Sonicate for 30 minutes.
Centrifuge for 10 minutes at 5000 g (or better).
Filter a portion of the supernatant using 0.45µm nylon filter discs (a two-stage or molecular weight cutoff filter may be used for difficult extracts). For example, a 2 mL filtered portion will allow 200 µL for the derivatization step and additional filtrate in the event that the derivatization needs to be repeated or if further work is necessary.
B. TMS-Derivatives
Sample Extracts:
Transfer 200 µL of filtrate from Step A to a GC vial.
Note: A smaller aliquot may be used provided that the necessary sensitivity level (10 µg/g of sample) is achieved. Reducing the amount of matrix present improves the general performance of the evaporation/derivatization step and saves wear and tear on the instrument.
Evaporate to dryness at 70°C (a low flow stream of dry air or nitrogen may be used).
Note: Taking the filtrate completely to dryness is a critical step in the derivatization process. The presence of water prevents formation of TMS derivatives of the analytes. If the internal standard response is much lower than usual (less than 30%), there may have been problems associated with the derivatization step. In addition, if the vial warms significantly to the touch after addition of the derivatization reagents, residual water was present and a new aliquot of filtrate must be prepared.
Add 200 µL pyridine.
Add 200 µL Sylon BFT.
Add 100 µL of the internal standard solution at 5.0 µg/mL in pyridine. This produces a concentration in the extract of 1.0 µg/mL.
Shake well or vortex to mix.
Incubate at 70°C for 45 minutes.
Ready for Injection.
Note: If insoluble material is observed at the bottom of the vial after 45 minute incubation, transfer liquid portion to another GC vial or filter before analysis.
C. Instrument Parameters
GC Conditions:
| Column | 30m DB-5MS 5% phenyl 95% dimethyl-polysiloxane ID: 0.25mm Film Thickness: 0.25 microns |
| Inlet Temperature | 280°C |
| Detector Temperature | 290°C |
| Injection Mode | Splitless |
| Injection Volume1 | 1 µL |
| Carrier Gas Flow | He at 35 cm/sec (constant flow) |
| Oven Program | 75°C (hold 1 minute) to 320°C at 15°C/minute (hold 2.67 min) for a total run time of 20 min. |
Note: Alternate GC conditions may be used provided that adequate resolution is obtained between the target analytes. Any such deviations from the method must be noted in corresponding documentation. With small volume liners, some peak splitting has been observed under the above conditions. Using a higher starting temperature (100°C) alleviated the problem. To help overcome interferences, significant additional resolution may be obtained by decreasing the ramp to 4°C/min over the interval 150°C to 200°C, which will shift the retention times.
MS Conditions (Full Scan Mode):
| Tune | Autotune (to maximize sensitivity across mass range) A +306V multiplier bump may be added after Autotuning |
| Acquisition parameters | EI; scan mode, 50-450 amu |
| Sampling Rate | 2 (scan rate at ~3.6 scans/sec) |
| Threshold | 100 |
| Filament Delay | 6 minutes |
| MS Temp | 230°C (Source); 150°C (Quad) |
MS Conditions (SIM Mode):
Select three or four ions to track: M, M+1, M-15 and another
| Group | Start Timea (min) |
Ionsb | |||||
|---|---|---|---|---|---|---|---|
| Mc | M + 1 | M + 2 | M - 15 | Other | Other | ||
| Urea / Biuret from di- and tri-TMS derivatives of uread |
6 | 276 (tri-tms) 204 (di-tms) |
189 (di-tms) 261 (tri-tms) |
171 | |||
| Cyanuric Acid | 9 | 345 (100)e |
346 (30) |
347 (14) |
330 (33) |
188 (11) |
|
| Ammelide | 10 | 344 (100) |
345 (30) |
346 (14) |
329 (50) |
286 (7) |
198 (28) |
| DACP (internal std.) | 10.85 | 288 | 289 | 290 | 273 | 275 | 237 |
| Ammeline | 11.3 | 343 (100) |
344 (30) |
345 (14) |
328 (115) |
285 (30) |
198 (27) |
| Melamine | 12 | 342 (54) |
343 (16) |
344 (8) |
327 (100) |
285 (12) |
197 (13) |
a Start Times may need to be adjusted based upon the retention time of standards on your system.
b Dwell times should be adjusted to produce a cycle time of about 4 scans/sec.
c M is the Molecular Ion for the tri - TMS derivative of the compound.
dUrea and Biuret are not formally part of the screen but they are related to the compounds of interest and may be detected.
e Percent relative abundance with respect to the most abundant ion from directly silylated standards under Standard Spectrum Autotune. The relative abundances should be confirmed under the conditions of use by evaluating standards.
If the sensitivity which is required to detect analyte spikes at 10 µg/g in the matrix cannot be achieved in full scan mode, use selected-ion monitoring (SIM) parameters below.
D. Peak Identification and Results
The approximate retention times of the tri-TMS derivatives are as follows (minutes):
| Cyanuric Acid | 9.4 |
| Ammelide | 10.6 |
| DACP | 11.0 (di-TMS derivative) |
| Ammeline | 11.6 |
| Melamine | 12.3 |
These need to be confirmed on your system and the parameters above adjusted to fit. Figure 1 is a standard chromatogram showing the cyanuric acid tri-TMS derivative (9.4 minutes), ammelide tri-TMS derivative (10.6 minutes), 2,6-diamino-4-chloropyrimdine di-TMS derivative (11.0 minutes), ammeline tri-TMS derivative (11.6 minutes) and melamine tri-TMS derivative (12.3 minutes). Figures 2 through 6 represent the mass spectra of each of these compounds.
When full scan mode is used and the matrix is even somewhat complicated, it is usually necessary to examine tracings of individual ions (extracted ion chromatograms) to observe the analytes. The extracted ion chromatograms may be generated for each analyte (see SIM table above for appropriate ions) which will help simplify the process of confirming positive or negative results (i.e. pulling things out of the grass). Ideally, each of these analytes and the internal standard can be entered into the data analysis portion of the Chemstation software as a target compound. By entering the appropriate retention time, ion ratios and peak area for each compound, the software can calculate sample results automatically. Results can be reviewed using the "QEdit" view which also provides an excellent visual display for documentation of sample results (see Figure 7 for a sample QEdit report for melamine).
In full scan mode, the criteria for identification of target analytes include the agreement of the retention times with those of the standards to within 0.05 minute. Also, the mass spectra need to correspond to those of the standards with no significant peaks absent. There may be additional peaks present due to overlap with other components but this should be examined carefully.
In SIM mode, the criteria for identification of target analytes include the agreement of the retention times with those of standards to within 0.05 minute. Mass spectral confirmation of an analyte is based upon the ratios of the integrated areas for selected ions to the integrated area of the most abundant of the selected ions being tracked. The criterion is that each ratio (as a percentage) corresponds to that observed for a standard to within 10 units. Using melamine as an example, track the ions at 342 (M), 327 (M-15) and 343 (M+1), use the data in the table above as representative of a standard. For a peak nominally identified as melamine based upon retention time, the ratio of the area of the peak (at 12.3 min) from m/z = 342 (M) to that of the area of the peak at m/z = 327 (M-15) needs to be between 44% and 64% while that of the ratio of the peak at m/z = 343 (M+1) to that of the area of the peak at m/z = 327 (M-15) needs to be between 6% and 26%.
E. Sample Fortification and Mixed Standard Preparation
A Mixed Standard Spiking solution is prepared by mixing portions of the stock standard solutions with 10/40/50 DEA/Water/Acetonitrile to create a solution which is 100 µg/mL of each analyte.
Spike Preparation
Weigh a 0.5 g portion of the matrix of interest into a 50 mL centrifuge tube. A previously analyzed, representative "blank" matrix may be used. If a representative matrix is not available, select one of the samples to be analyzed to use for spiking.
Add 50 µL (Low Spike) of Mixed Standard Spiking solution directly to the representative control sample and proceed with the method. The Low Spike must be observed to declare negatives as less than 10 µg/g. If it is not then negative samples will need to be re-analyzed.
A High Spike may also be prepared by adding 250 µL of Mixed Standard Spiking to another 0.5 g portion of the control. The High Spike provides an additional check in the event the Low Spike is not observed. The absence of the High Spike would serve as an indication of a major problem either with the sample preparation or the instrument.
High Standard
Dilute the Mixed Standard Spiking Solution to 10 µg/mL. Place 50 µL of this solution in a vial, evaporate to dryness, and take it through the derivatization reaction including the addition of the internal standard. This produces a High Standard at a concentration of 1.0 µg/mL of each analyte.
Low Standard
Dilute the Mixed Standard Spiking Solution to 1 µg/mL. Place 50 µL of this solution in a vial, evaporate to dryness, and take it through the derivatization reaction including the addition of the internal standard. This produces a Low Standard at a concentration of 0.10 µg/mL of each analyte.
F. Reporting
In the event that the analytes were observed in the representative control sample that was fortified at 10 µg/g, and no analyte signals were observed in the samples at levels which approach those in the fortified control, then the samples are not contaminated with melamine, ammeline, ammelide or cyanuric acid at levels in excess of 10 µg/g.
When it is close (within 50%), consider preparing additional portions from those samples along with a couple of additional fortified controls.
If it is clear that one or more of the analytes are present in the samples (based on the identification criteria above) and at levels in excess of 10 µg/g, then a semi-quantitative estimate may be obtained by comparing analyte responses to those from standards as described below.
G. Obtaining a Semi-quantitative Estimate of Target Analytes
Choose an ion to use for estimating the amount of the target analyte (usually the molecular ion). Using the High Standard (1.0 µg/mL) which was run at the beginning of the set of samples and the High Standard that was run at the end of the set of samples, calculate the average peak area for the selected ion. Apply the following formula:
Concentration in Derivatized Test Sample Extract (µg/mL) = Area (Test Sample) / Average Area (Standard) × 1.0 µg/mL.
Then, Concentration in Sample (µg/g) = Concentration in Derivatized Test Sample Extract (µg/mL) × 0.50 mL × 20.0 mL / 0.20 mL × 1 / Sample Wt. (g)
If the internal standard areas are very different (> 20%) between the test sample and the standard then adjust the area of each analyte response by dividing by the integrated area of the internal standard (from its molecular ion). Use these ratios in place of the integrated areas above. Consider re-analysis if the difference is extremely large since that may indicate a partially clogged syringe or other instrumental problem.
Finally, if the signal is more than 25 × larger than the signal from the standard, then prepare a new extract using 0.25 g of sample and 40 mL of the extraction solvent since the solubility limit for ammeline and ammelide in 10/40/50 DEA/water/acetonitrile is being approached.
As a general rule-of-thumb, the closer the analyte signal from the unknown is to the analyte signal from the standard, the better the estimate of the unknown concentration. So if more accurate numbers are required, prepare additional standards and re-analyze the samples in question.
Conclusion
This method was successfully applied to a variety of matrices including wet and dry animal food, wheat and corn gluten, rice and soy protein, health drink formulas, and dietary supplements. The method provided semi-quantitative analysis of all four target analytes from a single sample preparation. The use of a novel solvent system allowed dissolution of difficult analytes and disrupted the melamine-cyanurate complex. Method sensitivity was adequate to meet the minimum reporting level criteria of 10 µg/g for each target in multiple matrices. Due to the complexation of melamine and cyanuric acid, any methods developed for these analytes should demonstrate recovery of melamine in the presence of excess cyanuric acid and vice-versa.
Acknowledgements
The authors would like to acknowledge John B. Crowe and Mark R. Witkowski (FCC) for the crystal characterization work using microscopy and vibrational spectroscopy, Rick A. Flurer (FCC) for the DART®-Ion Trap-FTICR analysis, Laura A. Ciolino and Angela S. Mohrhaus (FCC) for the HPLC-UV analysis, Jan Bussey and Barbara Neuhaus (PRLNW) for help with extraction solvent evaluations and numerous analysts throughout the laboratories of the FDA for their valuable contributions.
References
- J. J. Litzau, G. E. Mercer, K. J. Mulligan, GC-MS Screen for the Presence of Melamine, Ammeline, Ammelide, and Cyanuric Acid, v. 2.1, FDA Center for Veterinary Medicine, Original Posting May 5, 2007 http://www.fda.gov/cvm/GCMSMelamine.htm
- David C. Sherrington and Kirsti A. Taskinen, Self-assembly in synthetic macromolecular systems via multiple hydrogen bonding interactions, Chem. Soc. Rev. , 2001, 30, 83 - 93
- Melamine and Cyanuric Acid Interaction May Play Part in Illness and Death from Recalled Pet Food, American Veterinary Medical Association (Press Release May 1, 2007)
Appendix 1: Guidance for Screening at a Minimum Reporting Level of 2.5 µg/g
(Appendix 1 should be used for human food and food ingredient testing)
The purpose of this section is to provide guidance for utilizing the GC-MS method to screen for the presence of melamine, ammeline, ammelide, and cyanuric acid in foods at levels to 2.5 µg/g. In experiments conducted at FCC, the target analytes were successfully detected at ~2.5 µg/g in some fortified milk-based products. There are some special problems to cope with at these low levels. The performance of the method must be verified in each laboratory using the recommended quality control elements in the procedure and the additional guidance below.
QC Elements
Because of prior observations of the carryover of cyanuric acid (and ammelide to a lesser extent), when low-level screening is being conducted, only the low standard preparation should be injected at the beginning of the sample set to minimize exposure of the instrument to the target compounds. The high standard preparation should only be used if a sample is found to be significantly contaminated (>10 µg/g) and a semi-quantitative estimate of the target analytes is desired. The carryover is most notable for the first few sample extracts in the sequence. This carryover may not be observed in method blanks or TMS-reagent blanks, but may appear intermittently when sample extracts are injected. To establish a background level of the target analytes (if it exists) on a particular instrument, it is advised that a preparation of a known negative (control) sample be injected immediately before the samples of interest and periodically throughout the sequence.
Each unique sample matrix should be fortified with each analyte at a level of 2.5 µg/g and analyzed along with the sample preparation. Analysis of this spiked sample must indicate the presence of each compound which serves to demonstrate system performance at the 2.5 µg/g level. The availability of fortified sample data for each unique matrix has proven to be very useful in eliminating false positive results due to matrix interferences.
Extraction Procedure and TMS-Derivatives
The extraction procedure and preparation of TMS-derivatives is conducted as described in Sections A and B. For matrices with high sugar content (e.g. candy), prepare composites using a 1:1 (by weight) mixture of sample and water, then take 1 g samples for extraction.
The presence of the derivatized internal standard serves to indicate that the silylation reaction has proceeded properly. However, some problems have been observed while trying to derivatize the analytes (particularly cyanuric acid) in the presence of a high sugar sample matrix. Results from several spiked samples indicate that the derivatization reaction seems to proceed preferentially with -NH2 groups first and -OH groups second. The spike recovery results for these samples looked fine for the internal standard and melamine (all -NH2 groups being derivatized) but had progressively lower responses for ammeline, ammelide and worst for cyanuric acid. The addition of another 200 µL of Sylon BFT raised these recoveries above 80%. If this method is used, calculations will need to be adjusted to account for the additional dilution.
The most probable source of difficulties in this area is the presence of water. This can happen when the sample is inadequately dried or if the matrix traps water and/or waters of hydration as solids crystallize out. There are a few ways to address this problem, one of which is to add additional Sylon BFT, as described above. Another approach is to dry the sample extract down to about 50 µL and add 200 µL of pyridine. Then, take this mixture to dryness before the addition of the reaction mixture: 200 µL of pyridine, 200 µL of Sylon BFT and 100 µL of the internal standard solution. Pyridine forms a meaningful azeotrope with water and aids in its removal.
Instrument Parameters
GC conditions are as described in Section C. Alternate GC conditions may be used provided that adequate resolution is obtained between the target analytes. Any such deviations from the method must be noted in corresponding documentation. With small volume liners, some peak splitting has been observed under the original conditions. Using a higher starting temperature (100°C) alleviated the problem. To help overcome interferences, significant additional resolution may be obtained by decreasing the ramp to 4°C/min over the interval 150°C to 200°C, which will shift the retention times.
To achieve the required sensitivity, mass spectral data must be collected using selected-ion monitoring (SIM). Create five groups to monitor using the ions and start times as described below.
MS Conditions (SIM Mode):
Select three or four ions to track: M, M+1, M-15 and another
| Group | Start Timea (min) |
Ionsb | |||||
|---|---|---|---|---|---|---|---|
| Mc | M + 1 | M + 2 | M - 15 | Other | Other | ||
| Cyanuric Acid | 9 | 345 (100)d |
346 (30) |
347 (14) |
330 (33) |
188 (11) |
|
| Ammelide | 10 | 344 (100) |
345 (30) |
346 (14) |
329 (50) |
286 (7) |
198 (28) |
| DACP (internal std.) | 10.85 | 288 | 289 | 290 | 273 | 275 | 237 |
| Ammeline | 11.3 | 343 (100) |
344 (30) |
345 (14) |
328 (115) |
285 (30) |
198 (27) |
| Melamine | 12 | 342 (54) |
343 (16) |
344 (8) |
327 (100) |
285 (12) |
197 (13) |
a Start Times may need to be adjusted based upon the retention time of standards on your system.
b Dwell times should be adjusted to produce a cycle time of about 4 scans/sec.
c M is the Molecular Ion for the tri - TMS derivative of the compound.
d Percent relative abundance with respect to the most abundant ion from directly silylated standards under Standard Spectrum Autotune. The relative abundances should be confirmed under the conditions of use by evaluating standards.
The criteria for identification of target analytes include the agreement of the retention times with those of standards to within 0.05 minute. Mass spectral confirmation of an analyte is based upon the ratios of the integrated areas for selected ions to the integrated area of the most abundant of the selected ions being tracked. The criterion is that each ratio (as a percentage) corresponds to that observed for a standard to within 10 units. Using melamine as an example, track the ions at 342 (M), 327 (M-15) and 343 (M+1), use the data in the table above as representative of a standard. For a peak nominally identified as melamine based upon retention time, the ratio of the area of the peak (at 12.3 min) from m/z = 342 (M) to that of the area of the peak at m/z = 327 (M-15) needs to be between 44% and 64% while that of the ratio of the peak at m/z = 343 (M+1) to that of the area of the peak at m/z = 327 (M-15) needs to be between 6% and 26%.
Due to the complex nature of the matrices to be screened and the levels of interest, ion ratios for the target analytes may vary beyond the limits described above. If a significant peak is observed that exhibits all of the ions and the retention time of a target analyte but ion ratios are outside the accepted limits, additional experiments must be conducted to investigate the peak. This can include additional sample preparations, alternate GC temperature programs, or analysis of the sample by another technique such as LC-MS.
Sample Fortification and Mixed Standard Preparation
Spike Preparation
Prepare a fortified sample by weighing a 0.5 g portion of each unique matrix into a 50 mL centrifuge tube. Dilute the mixed standard spiking solution (100 µg/mL of each target analyte) with extraction solvent to create a solution which is 50 µg/mL of each analyte. For 2.5 µg/g spikes, add 25 µL of this solution directly to the matrix of interest and proceed with the method.
Matrix Standard Preparation
- Transfer 200 µL of filtered extract of the sample of interest to a GC vial.
- Dilute the mixed standard spiking solution (100 µg/mL of each target analyte) to 0.5 µg/mL using extraction solvent.
- Add 50 µL of the 0.5 µg/mL standard solution to the vial. This level corresponds to a level of 5 µg/g sample concentration.
- Evaporate to dryness and proceed with preparing the TMS-derivative as described in Section B.
- Analyze the matrix standard preparation at the beginning of a set of samples and then again at the end of the set.
Reporting
In the event that the analytes are observed in the sample preparation that was fortified at 2.5 µg/g, and no analyte signals are observed in the samples at levels which approach those in the fortified sample, then the samples are not contaminated with melamine, ammeline, ammelide or cyanuric acid at levels in excess of 2.5 µg/g.
When it is close (within 50%), consider preparing additional portions from those samples along with a couple of additional fortified samples. If these additional preparations also indicate the presence of one or more target analytes near the 2.5 µg/g level, consider analyzing the sample using a more sensitive technique such as LC-MS-MS for confirmation.
If it is clear that one or more of the analytes are present in the samples (based on the identification criteria above) and at levels at or in excess of 2.5 µg/g (but less than 10 µg/g) then a semi-quantitative estimate may be obtained by comparing analyte responses to those from a matrix-matched standard at a level which is equivalent to 5 µg/g in the sample (or 0.050 µg/mL in the derivatized extract with the internal standard added). A matrix-matched standard is a sample extract which contains known amounts of the analytes. It is most conveniently prepared by adding a known amount of the analytes to an extract from an uncontaminated sample immediately before the dry-down / derivatization step. An easier alternative approach (with a minor compromise because a bit less matrix is present) would be to prepare it by adding 50 µL of a derivatized standard (at 0.55 µg/mL) which contains the internal standard to 500 µL of derivatized extract which contains the internal standard.
Obtaining a Semi-Quantitative Estimate of Target Analytes
Analysis of matrix-matched standards in comparison to reagent-only standards indicates a strong analyte-protecting effect for the compounds of interest. This effect is particularly evident when working with low level standards (standards in the range corresponding to 2.5-10 µg/g sample concentration).
Note: This effect is known to vary from instrument to instrument, across different inlet liners and liner packing materials, and from matrix to matrix. If the effect is minimal then the semi-quantitative estimate of results may be obtained using the procedure described in Section G with the exception of using the low standard average response (run at the beginning and end of the sample set) in place of the high standard.
If the matrix effect is pronounced, a matrix-matched standard preparation can be used to obtain an estimate of low levels (2.5-10 µg/g) of target analytes in the sample as described below.
Choose an ion to use for estimating the amount of the target analyte (usually the molecular ion except for melamine which is substantially more sensitive at m/z = 327). Using the matrix standard preparation which was run at the beginning and end of the sample set, calculate the average peak area for the selected ion. Apply the following formula:
Concentration in Derivatized Test Sample Extract (µg/mL) = Area (Test Sample) / Average Area (Matrix Standard) × 0.05 µg/mL.
Then, Concentration in Sample (µg/g) = Concentration in Derivatized Test Sample Extract (µg/mL) × 0.50 mL × 20.0 mL / 0.20 mL × 1 / Sample Wt. (g)
If the internal standard areas are very different (> 20%) between the Test Sample and the Matrix Standard preparations, then adjust the area of each analyte response by dividing by the integrated area of the internal standard (from its molecular ion). Use these ratios in place of the integrated areas above. Consider re-analysis if the difference is extremely large since that may indicate a partially clogged syringe or other instrumental problem.
In the event that analysis of the unfortified Test Sample indicates a low level of the analyte, then subtract the Area (Test Sample) from the Average Area (Matrix Standard) and substitute this Corrected Average Area (Matrix Standard) for the Average Area (Matrix Standard) in the calculation above. It is best if two separate derivatizations are made from the Test Sample so that an Average Area (Test Sample) can be used.
If the Area (Test Sample) is greater than half the Area (Matrix Standard), then another Test Sample should be chosen to prepare the Matrix Standard.
Spike recoveries for melamine and ammeline in some representative samples using matrix-matched standards at the 2.5 µg/g level were acceptable based on limited experiments at FCC. Less reliable results may be observed in spike recoveries for cyanuric acid and ammelide at low levels due to carryover issues as discussed earlier.
If the target analyte(s) are present at levels above 10 µg/g, then a semi-quantitative estimate can be obtained using the procedure described in Section G.
| Matrix | Spiking Level (µg/g) |
Average Percent Recovery (N=2, Range in Parentheses) |
|||
|---|---|---|---|---|---|
| Cyanuric Acid | Ammelide | Ammeline | Melamine | ||
| Wheat Gluten (a) | 10 | 84 (16) |
90 (20) |
86 (23) |
79 (10) |
| 50 | 87 (13) |
88 (16) |
86 (13) |
74 (11) |
|
| Rice Protein (a) | 10 | 98 (2) |
101 (4) |
96 (3) |
96 (2) |
| 50 | 107 (1) |
108 (3) |
108 (1) |
101 (0) |
|
| Wet Pet Food (a) | 10 | 106 (1) |
103 (5) |
114 (13) |
105 (6) |
| 50 | 107 (3) |
107 (0) |
111 (7) |
106 (5) |
|
| Corn Gluten (b) | 10 | 139 (86) |
166 (96) |
172 (105) |
152 (93) |
| 50 | 103 (4) |
103 (3) |
98 (5) |
90 (4) |
|
| Soybean Meal (b,c) | 10 | 120 (44) |
118 (8) |
164 (150) |
152 (76) |
| 50 | 97 (7) |
90 (12) |
90 (10) |
88 (11) |
|
| Dry Cat Food Salmon Flavor (b) | 10 | 158 (41) |
142 (33) |
134 (44) |
126 (26) |
| 50 | 81 (3) |
82 (4) |
74 (5) |
77 (5) |
|
Notes:
(a) 0.5 g extracted into 20 mL of 10/40/50 DEA/H2O/CH3CN (v/v/v). 0.20 mL extract to 0.45 mL silylated preparation. Analysis using scan mode on a 5975i MSD. Extracted ion chromatograms were used to determine area response for molecular ions.
(b) 0.5 g extracted into 10 mL of 10/40/50 DEA/H2O/CH3CN (v/v/v). 0.20 mL extract to 0.45 mL silylated preparation. Analysis by SIM on an Agilent 5973 MSD.
(c) Rubbery precipitate in some final extracts that can clog the syringe
Figure 1: Standard chromatogram showing the TMS derivatives of target compounds

Figure 2: Cyanuric Acid tri-TMS derivative mass spectrum

Figure 3: Ammelide tri-TMS derivative mass spectrum

Figure 4: Ammeline tri-TMS derivative mass spectrum

Figure 5: Melamine tri-TMS derivative mass spectrum

Figure 6: 2,6-Diamino-4-chloropyrimidine di-TMS derivative mass spectrum
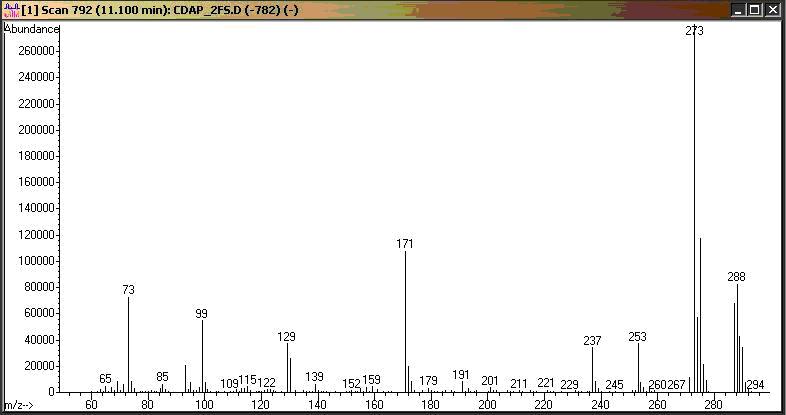
Figure 7: Example of a QEdit report for melamin

Chemical Name: melamine
IUPAC International Chemical Identifier: InChI=1/C3H6N6/c4-1-7-2(5)9-3(6)8-1/h(H6,4,5,6,7,8,9)
InChIKey: JDSHMPZPIAZGSV-UHFFFAOYAF
Chemical Name: ammeline
IUPAC International Chemical Identifier: InChI=1/C3H5N5O/c4-1-6-2(5)8-3(9)7-1/h(H5,4,5,6,7,8,9)
InChIKey: MASBWURJQFFLOO-UHFFFAOYAL
Chemical Name: ammelide
IUPAC International Chemical Identifier: InChI=1/C3H4N4O2/c4-1-5-2(8)7-3(9)6-1/h(H4,4,5,6,7,8,9)/f/h8-9H,4H2
InChIKey: YSKUZVBSHIWEFK-DYUMPDCECB
Chemical Name: cyanuric acid
IUPAC International Chemical Identifier: InChI=1/C3H3N3O3/c7-1-4-2(8)6-3(9)5-1/h(H3,4,5,6,7,8,9)
InChIKey: ZFSLODLOARCGLH-UHFFFAOYAR