2021 FDA Science Forum
Analysis and Reporting Pipeline for Cardiac Ion Channel Pharmacology Data
- Authors:
- Center:
-
Contributing OfficeCenter for Drug Evaluation and Research
Abstract
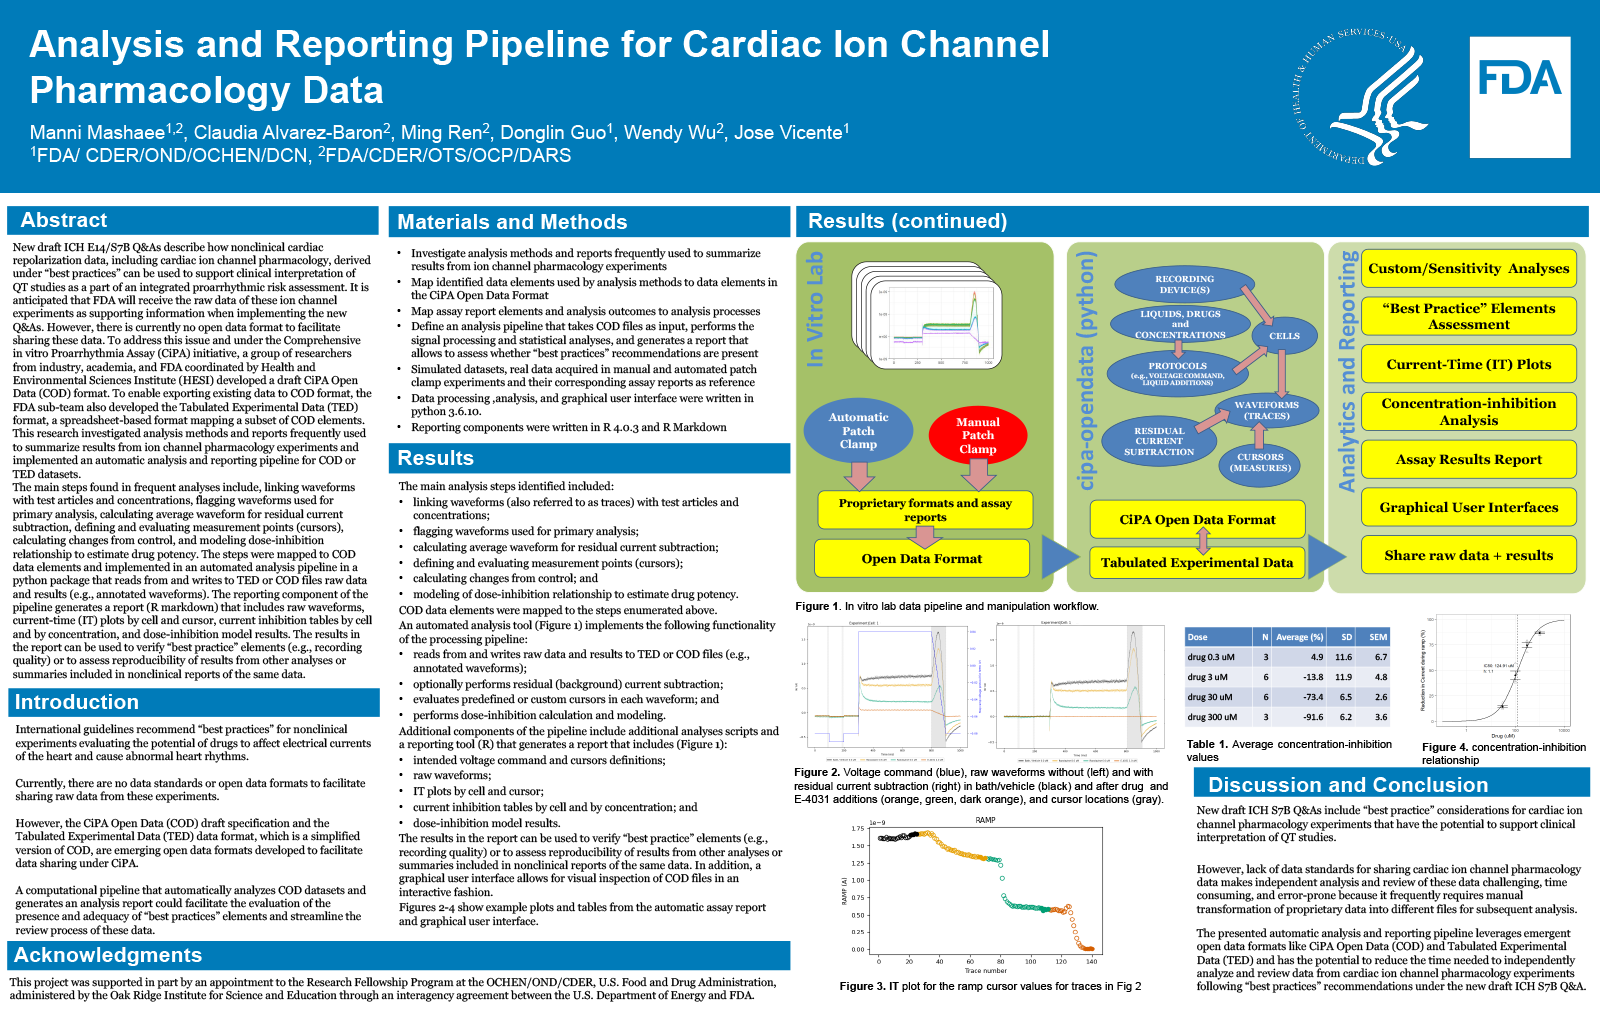
New draft ICH E14/S7B Q&As describe how nonclinical cardiac repolarization data, including cardiac ion channel pharmacology, derived under “best practices” can be used to support clinical interpretation of QT studies as a part of an integrated proarrhythmic risk assessment. It is anticipated that FDA will receive the raw data of these ion channel experiments as supporting information when implementing the new Q&As. However, there is currently no open data format to facilitate sharing these data. To address this issue and under the Comprehensive in vitro Proarrhythmia Assay (CiPA) initiative, a group of researchers from industry, academia, and FDA coordinated by Health and Environmental Sciences Institute (HESI) developed a draft CiPA Open Data (COD) format. To enable exporting existing data to COD format, the FDA sub-team also developed the Tabulated Experimental Data (TED) format, a spreadsheet-based format mapping a subset of COD elements. This research investigated analysis methods and reports frequently used to summarize results from ion channel pharmacology experiments and implemented an automatic analysis and reporting pipeline for COD or TED datasets.
The main steps found in frequent analyses include: linking waveforms with test articles and concentrations, flagging waveforms used for primary analysis, calculating average waveform for residual current subtraction, defining and evaluating measurement points (cursors), calculating changes from control, and modeling dose-inhibition relationship to estimate drug potency. The steps were mapped to COD data elements and implemented in an automated analysis pipeline in a python package that reads from and writes to TED or COD files raw data and results (e.g., annotated waveforms). The reporting component of the pipeline generates a report (R markdown) that includes raw waveforms, current-time (IT) plots by cell and cursor, current inhibition tables by cell and by concentration, and dose-inhibition model results. The results in the report can be used to verify “best practice” elements (e.g., recording quality) or to assess reproducibility of results from other analyses or summaries included in nonclinical reports of the same data.
This analysis and reporting pipeline leverages emerging formats and could support and streamline the review process of cardiac ion channel pharmacology experiments following current “best practices” recommendations.