

Ethylene Oxide Sterilization 2 Graphical Aid to Determine Gas Concentration
[Previous Chapter] [Table of Contents] [Next Chapter]
WELFARE PUBLIC HEALTH SERVICE
FOOD AND DRUG ADMINISTRATION
*ORA/ORO/DEIO/IB*
Related Program Areas:
Sterile Devices, Drugs
ITG SUBJECT: ETHYLENE OXIDE STERILIZATIONS
II. Graphical Aid to Determine Gas Concentration
ITG5 describes two methods for determining ethylene oxide (EtO) concentrations attained during sterilization procedures. Briefly these methods were 1) By weight calculations. 2) By means of the Ideal Gas formula. This issue provides the investigator a graphical method to determine rapidly the EtO levels attained as shown by the instruments or by the sterilization records. One can examine the instruments and the sterilizer recording charts, extract the data, and refer quickly to the graphical aid (reverse of this sheet) to read the effective EtO concentration.
The graphical aid \a\ on the reverse side (Figure [FIGURE]) may be used for determining any one of five factors needed for control of the EtO sterilization provided that the other four factors are known. These factors are 1) Initial Pressure from 0 to minus 30 inches Hg. 2) Final Pressure from minus 30 inches Hg. to plus 30 PSIG \b\ 3) Temperature from 20 C to 80 C. 4) Common Gas Mixtures or 100% EtO. The graph allows for 10% EtO and 90% CO 2; 20% EtO and 80% CO 2; 12% by wt EtO (27% by volume) in dichlorodiflouromethane; and 100% EtO. 5) EtO concentration (mg/L). Example: During an investigation, a firm’s sterilizer chart has the following conditions recorded: a) The Initial Pressure at 0 inches when the door was open, went to 25 inches Hg. vacuum in the initial phase of sterilization. b) The temperature inside the sterilizing vessel was maintained at 60 C. c) The maximum sustained pressure was 27 PSIG. d) Purchasing records show that the firm buys 20% EtO and 80% CO 2 in pressurized 55 gallon drums. From the graph on the reverse side, determine the concentration of the sterilant used.
Solution: Products in this gas sterilizer were subjected to 845 mg/L EtO. The use of the chart for this example is shown on the reverse side. It is recognized that moisture, added to the sterilizing process will have an additive effect on the absolute pressure in the sterilizer, however it is not necessary to use the % Relative Humidity parameter in determining the approximate EtO by this graphical method.
For additional reading, Industrial Sterilization (International Symposium, Amsterdam 1972) G. Briggs Phillips; Wm. S. Miller; Duke University Press, is available in most districts.
We would be interested in seeing any similar charts or quick (EtO) determination aids that may be in use. \a\Industrial Graph used by permission of the author.
\b\Pounds per square inch force measured by the gauge. PSIG is 0 at ambient atmospheric pressure.
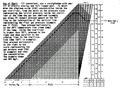
Use of Chart: (If convenient, use a straightedge with pencil or plastic overlay and felt tipped pen). To determine the ethylene oxide (EtO) concentration inside the gas sterilizer, from the point on the pressure scale representing the initial pressure inside the sterilizer at the time the gas was admitted (example was minus 25 inches) proceed upward on the 45 line to the intersection of the vertical line representing the final gas pressure (example was 27 PSIG). Then proceed horizontally to the 20 C temperature line (room temp). If the temp. inside the sterilizer is higher than 20 C, proceed to the right and down parallel to the sloping lines to the sterilization temp (60 C in example). Then proceed horizontally to the right to the scale representing the gas mixture used (20% in example) and read the concentration. The example shown was 845 mg/L.