

Laboratory Information Bulletin (LIB) 4396: Melamine Residues in Catfish Tissue
Determination of Melamine Residues in Catfish Tissue by Triple Quadrupole LC-MS-MS with HILIC Chromatography
Volume 23, May 2007
Wendy C. Andersen, Sherri B. Turnipseed, Christine M. Karbiwnyk, and Mark R. Madson
U.S. Food and Drug Administration, Animal Drugs Research Center, Denver, CO
Note: The Laboratory Information Bulletin is a communication from the Division of Field Science, Office of Regulatory Affairs, U.S. Food and Drug Administration for the rapid dissemination of laboratory methods (or scientific regulatory information) which appear to solve a problem or improve an existing problem. In many cases, however, the report may not represent completed analytical work. The reader must assure, by appropriate validation procedures, that the reported methods or techniques are reliable and accurate for use as a regulatory method. Reference to any commercial materials, equipment, or process does not, in any way, constitute approval, endorsement, or recommendation by the U.S. Food and Drug Administration.
ABSTRACT
A triple quadrupole liquid chromatography tandem mass spectrometry method is presented for the quantitative determination and confirmation of melamine residues in catfish. Catfish tissue was extracted with 50:50 acetonitrile:water and 1 N hydrochloric acid and cleaned-up using Oasis® MCX solid phase extraction cartridges. Extracts were analyzed by LC-MS-MS with HILIC chromatography and electrospray ionization in positive ion mode. The precursor ion for melamine is m/z 127. Two product ion transitions were monitored at m/z 85 and 68 for quantification and confirmation. Catfish tissue was fortified at 10, 25, 50, 100, and 500 ng/g (ppb). The average recovery of melamine from fortified samples (n = 17) was 76.3 % with an RSD of 14.3 %.
INTRODUCTION
Pet food, animal feed, wheat gluten, and other protein-based food commodities were recently found to contain residues of melamine, an industrial chemical used in the manufacturing of plastics, flame retardants, and other products. It is not approved by the U.S. Food and Drug Administration for use in food or animal feed. Because animals may eat food contaminated with melamine residues, there is a need for analytical methods to determine melamine residues that may be present in animal tissues. This Laboratory Information Bulletin presents a method for the determination of trace levels of melamine in catfish muscle.
EXPERIMENTAL
Equipment and reagent sources have been provided for information and guidance. Equivalent products may be substituted as appropriate.
Equipment
- LC/MS/MS instrument: Thermo (San Jose, CA) TSQ Quantum triple quadrupole mass spectrometer coupled to a Thermo Surveyor LC-MS pump and autosampler. A metal needle sample kit was installed on the electrospray source; the orientation of the spray to the orifice was set at the second notch (approx 62 deg offset). XCaliber V.4 software was used to acquire and analyze the data.
- LC column - Atlantis® HILIC Silica column, 3 µm, 3.0 × 50 mm (P/N 186002017, Waters Corp., Milford, MA).
- Blender/homogenizer - RobotCoupe Blixer, homogenizer, 4 quart, model RS1BX4V (RobotCoupe USA, Inc., Ridgeland, MS).
- Vortex Mixer - Vortex Genie 2, (Scientific Industries, Bohemia, NY).
- Centrifuge - refrigerated to 5 °C, capable of accelerating 50 mL tubes to 4000 rpm (2730 rcf).
- Evaporator - TurboVap® LV nitrogen evaporator with thermostatted water bath (P/N 103198, Zymark, Hopkinton, MA).
- SPE Cartridge - Oasis® MCX solid phase extraction columns, 6 mL, 150 mg, (P/N 186000255, Waters Corp., Milford, MA).
- Syringe filters - Acrodisc® 13 mm syringe filter with 0.2 µm nylon membrane (P/N 4550T, Pall Life Sciences) with 1 mL disposable syringe (P/N 309602, Becton Dickinson, Franklin Lakes, NJ).
- Centrifuge tubes - 50 mL disposable, conical, graduated, polypropylene tubes with cap; 15 mL disposable, conical, graduated, polypropylene tubes with cap (Falcon® Blue Max™, P/N 50 mL tubes 352070, 15 mL tubes 352097, Becton Dickinson, Franklin Lakes, NJ).
- Volumetric glassware and pipettors - 100.0 and 10.0 mL volumetric flasks, class A; adjustable volume pipettors with disposable polypropylene tips - 10-100 µL (Eppendorf, Brinkmann Instruments, Inc., Westbury, NY), 200-1000 µL (Ulster Scientific, Inc., New Paltz, NY), and 1-5 mL (Wheaton Science Products, Millville, NJ).
- Glassware and LC vials - disposable glass culture tubes (16x100 mm), disposable Pasteur pipettes; 2 mL glass LC vials with snap caps.
Reagents and Standards
- Melamine (MEL) was obtained from Sigma-Aldrich (99+% purity, FW 126.12, CAS 108-78-01, cat. no. 240818, St. Louis, MO).
- Solvents - high purity chromatographic and spectrophotometric grade acetonitrile and methanol were used. Dichloromethane was liquid chromatographic grade. All water used was deionized and purified to 18.2 MΩ•cm (Millipore, Bedford, MA).
- Hydrochloric acid - concentrated, ACS grade, (CAS 7647-01-0, EMD Chemicals, Inc., Gibbstown, NJ). Solutions with concentrations 1.0 M and 0.1 M of HCl in water are used in this method.
- Ammonium hydroxide - concentrated, ACS grade, (CAS 1336-21-6, EMD Chemicals, Inc., Gibbstown, NJ). This was used to prepare solutions with concentrations of 2 % NH4OH in water (v:v) (for standards) and 5 % NH4OH in methanol (v:v).
- Ammonium formate - reagent grade (CAS 540-69-2, Sigma-Aldrich, St. Louis, MO). This was used to prepare a 20 mM solution in water.
- Extraction solution - 50:50 (v:v) acetonitrile:water.
- Mobile phase - The mobile phase solvents were acetonitrile and 20mM ammonium formate buffer. These were used in the LC gradient elution program. Additionally, a solution containing 95:5 (v:v) acetonitrile:ammonium formate (20mM) was used to prepare calibration standards and reconstitute extracts.
Standard Solutions
Stock solution: 10.00 mg of melamine (MEL) was added to a 100.0 mL volumetric flask and diluted to mark with a solution of 2 % ammonium hydroxide in water (v:v) to produce a stock solution with a concentration of 100.0 µg/mL. The solution was sonicated for 20-30 minutes until crystals of melamine were no longer visible.
Intermediate solutions: A 10.0 µg/mL standard was prepared by adding a 1.0 mL aliquot of the MEL stock to a 10.0 mL volumetric flask and diluting to the mark with water. A 1.0 µg/mL standard was prepared by adding a 1.0 mL aliquot of the MEL stock to a 100.0 mL volumetric flask and diluting to the mark with water.
Calibration standards: Calibration curves were constructed from calibration standards of melamine with concentrations of 10, 25, 50, 100, 500, 1000, and 2000 ng/mL. These calibrants were prepared daily using appropriate aliquots of the 1 and 10 µg/mL melamine intermediate solutions diluted to 5 mL with 95:5 acetonitrile:ammonium formate mobile phase.
Control Tissues
Control tissues were fillets of fresh or frozen, aquacultured catfish that were obtained from a local market, from the FDA Gulf Coast Seafood Laboratory (GCSL), and from the FDA Center for Veterinary Medicine (CVM).
Tissue preparation
Skinless fillets of catfish were blended with dry ice in a blender/homogenizer with pulsed action until the contents were uniform and had the consistency of a fine powder. The homogenate was placed in a Whirl-Pak bag, loosely sealed and stored in the freezer (-25 °C) overnight to allow the carbon dioxide to dissipate, and then sealed until the time of analysis. Tissue may be ground by this or an equivalent method.
Sample Fortification
To 5.0 g of thawed control catfish tissue, the following aliquots of intermediate standard solutions were added to produce fortified tissue with final concentrations corresponding to:
10 ng/g - 50 µL of 1 µg/mL MEL solution
25 ng/g - 125 µL of 1 µg/mL MEL solution
50 ng/g - 25 µL of 10 µg/mL MEL solution
100 ng/g - 50 µL of 10 µg/mL MEL solution
500 ng/g - 25 µL of 100 µg/mL MEL stock solution
Fortified samples were allowed to equilibrate 15 minutes prior to extraction.
Extraction
This extraction is a modification of the UC Davis method1. Homogenized catfish tissue (5.0 g) was weighed into a 50 mL polypropylene centrifuge tube. To this was added 24 mL of a 50:50 (v:v) solution of acetonitrile:water and 1 mL of 1.0 N hydrochloric acid. The sample was capped, shaken vigorously for 30 seconds and then vortex mixed for 1 minute. The sample was centrifuged at 4000 rpm for 5 minutes at 5 °C. Breaking through the solid fat layer at the top of the sample with the tip of a pipette, a 5 mL aliquot of supernatant was removed to a 15 mL polypropylene centrifuge tube. The remaining portion in the 50 mL tube was discarded. Dichloromethane (10 mL) was added to the contents of the 15 mL tube, and the sample was shaken for two minutes. The sample was centrifuged at 4000 rpm for 5 minutes at 5 °C. A portion (2.5 mL) of the upper aqueous layer was carefully removed to a glass culture tube. Water (2.5 mL) was added to the dichloromethane layer and that sample was re-extracted by shaking for 1 minute. The polypropylene tube was again centrifuged at 4000 rpm for 5 minutes at 5 °C, and the entire upper aqueous layer was removed and combined with the first aqueous extract in the glass culture tube. This extract was vortex mixed for 5 seconds.
An Oasis MCX SPE cartridge was used to clean-up sample extracts. All SPE elution steps including conditioning, sample application, washing, and the final elution were performed without the application of vacuum. Vacuum was only applied to dry the cartridges. The SPE cartridge was conditioned with 5 mL of methanol followed by 5 mL of water. The sample was applied to the conditioned cartridge and allowed to elute by gravity. The column was washed with 5 mL of 0.1 N HCl, followed by 2 mL of methanol. The cartridge was dried by applying vacuum for 1 minute. The column was eluted into a glass culture tube using 5 mL of 5 % ammonium hydroxide in methanol. The eluate was evaporated to dryness at 55 °C under flowing nitrogen at 15 psi for 20 minutes. The dried extract was reconstituted in 1.0 mL of 95:5 acetonitrile:ammonium formate (20 mM), vortex mixed for 10 seconds, and filtered through a 0.2 µm nylon syringe filter into a glass LC vial.
Several end spikes (ES) were evaluated to determine the loss of instrumental sensitivity due to ion suppression and to confirm that solvent standards, rather than matrix standards, could be used in this method. For these, control tissue was extracted according to the procedure above, but before the final dried extract was reconstituted in mobile phase, an appropriate aliquot of standard was added to the culture tube. Acetonitrile:ammonium formate (20 mM) (95:5) was then added to produce a final volume of 1.0 mL. For example:
10 ng/g ES - 10 µL of 1 µg/mL standard plus 975 µL of mobile phase
25 ng/g ES - 25 µL of 1 µg/mL standard plus 900 µL of mobile phase
50 ng/g ES - 50 µL of 1 µg/mL standard plus 950 µL of mobile phase
100 ng/g ES - 100 µL of 1 µg/mL standard plus 900 µL of mobile phase
500 ng/g ES - 50 µL of 10 µg/mL standard plus 950 µL of mobile phase
These samples were then vortex mixed for 10 seconds and syringe-filtered into a glass LC vial.
LC-MS-MS Analysis
The LC-MS-MS electrospray conditions were optimized by tuning with a 10 ng/µL solution of MEL flowing into the mass spectrometer with a syringe pump at 10 µL/min while 350 µL/min of 75:25 acetontrile:ammonium formate buffer (20 mM) was added via a T-union. The combined stream was introduced into the electrospray interface. Selected reaction monitoring (SRM) MS/MS was performed on the protonated molecular ion for MEL using the following general parameters: Source voltage = 5 kV; Capillary temperature = 270 °C; Sheath gas (nitrogen) = 14 (arbitrary) units; Auxiliary gas (nitrogen) = 0 (arbitrary) units; Q1 peak width = 0.7 amu; Q3 peak width = 0.7 amu; Collision gas = 1.5 torr Argon; peak width = 1 amu, and scan time = 0.5 sec. Source collision induced dissociation was set to 20 V.
It should be noted that the following scan events and mobile phase gradient for the LC-MS-MS were set up in this method validation to detect not only melamine, but also ammeline (ANE), ammelide (ADE), and cyanuric acid (CYA). As will be described below, the extraction described herein was only suitable for the determination of melamine. For the first 1.3 minutes after sample injection, a negative ion scan event was included (m/z 128→85) to detect cyanuric acid, but this compound was not evaluated at this time. For the rest of the chromatographic run, three positive ion scan events with two SRM transitions each were monitored according to the following chart:
| Compound | Retention Time (min) | Precursor Ion (m/z) | Quantitative SRM transition (m/z) (Collision Energy) |
Confirmatory SRM transition (m/z) (Collision Energy) |
|---|---|---|---|---|
| MEL | 2.7 | 127 | 85 (7) | 68 (23) |
| ANE | 3.1 | 128 | 86 (5) | 69 (26) |
| ADE | 2.0 | 129 | 87 (14) | 70 (27) |
The LC-program for the three amine compounds was based on one developed at Procter and Gamble. A Waters Atlantis HILIC silica column was used with an acetonitrile:ammonium formate buffer (20 mM) gradient. The mobile phase composition started out at 95 % acetonitrile and decreased (linearly) to 50 % acetonitrile over 5 minutes. The mobile phase was then returned to 95 % acetonitrile between 5 and 7 minutes, and the column was re-equilibrated for 5 minutes. The flow rate was 350 µL/min. The column was kept in an insulated compartment, but the temperature was not controlled. The injection volume was 10 µL and the needle was flushed with 400 µL of 50:50 water:methanol between samples. The LC flow was diverted to waste for the first 0.14 minutes and again at 6 minutes.
Quantitative data was obtained from the area counts of the chromatographic peak observed with the SRM of the m/z 127→85 selective ion monitoring transition using QuanBrowser® software and the ICIS integration program. The melamine found in each fortified sample was calculated from the peak areas of this transition using a calibration curve generated from melamine standards with concentrations ranging from 10 to 2000 ng/mL (ppb) in mobile phase. For confirmation, peak area counts from the m/ z127→85 and m/z 127→68 SRM transitions were generated with the ICIS algorithm in the QualBrowser® software program. Gaussian smoothing function of five points was applied. Relative abundances were calculated from these peak areas and compared to contemporary standards.
RESULTS AND DISCUSSION
Melamine was extracted from fortified catfish with an average recovery of 76.3 % (14.3 % RSD, n = 17) over the concentration range 10 to 500 ng/g (ppb), as summarized in Table 1. The observed relative abundance data for the two transitions is summarized in Table 2, and selected SRM chromatograms are presented in Figure 1. Melamine was confirmed in all spikes. The method was validated using control tissue from three different sources. The controls were skinless catfish fillets obtained from: a local market, the FDA Gulf Coast Seafood Laboratory, and FDA's Center for Veterinary Medicine. The recovery of melamine from 100 ng/g fortified tissue was comparable among the three sources of tissue with recoveries of 69.3 % for GCSL catfish, 75.5 % for CVM catfish, and 73.4, 72.9, and 74.4 % for three samples of market catfish.
In the control catfish tissue, a small peak was observed at the retention time for melamine at a level that could not be quantified. The signal-to-noise ratio of this peak was not greater than 3:1. Melamine was not confirmed in any of the control tissues. Melamine was not detected in the method blank.
The standard curve for solvent-based external standards was linear over the range from 10 to 2000 ng/g. Two calibration curves were prepared for two different days of analysis. One was over the range 10 to 100 ng/mL with r2 = 0.9972, and the other was over the range 25 to 2000 ng/mL with r2 = 0.9997. The end spike samples analyzed in conjunction with the fortified samples had recoveries ranging from 87.6 to 97.8 % indicating that ion suppression was not significant. The use of solvent-based standards is justified for this method. An internal standard was not used in this method.
In addition to melamine, tissues were also fortified with ammeline (ANE) and ammelide (ADE) (standards were prepared similarly to those for MEL). However, the recovery of ANE and ADE from fortified tissues was low. Approximately 15 % of the ANE residue was recovered from the tissue at the 100 ng/g fortification level, and 32 % was recovered at the 500 ng/g fortification level. ANE was not detected at the 50 ng/g fortification level. ADE was only 3 % recovered at the 500 ng/g fortification level, and could not be detected at the lower levels. The current extraction procedure is not acceptable for these compounds.
| Sample | Average % Recovery ± % RSD (n) |
|---|---|
| Control | Not Confirmed (n = 4) |
| Method Blank | Not Detected (n = 1) |
| 10 ng/g Fortified Catfish | 90.3 ± 5.2 % (n = 3) |
| 25 ng/g Fortified Catfish | 87.3 ± 9.4 % (n = 3) |
| 50 ng/g Fortified Catfish | 69.5 ± 3.1 % (n = 3) |
| 100 ng/g Fortified Catfish | 73.1 ± 3.2 % (n = 5) |
| 500 ng/g Fortified Catfish | 62.6 ± 6.3 % (n = 3) |
| Day | Samples | % Relative Abundance m/z 127→68 transition relative to the m/z 127→85 transition |
|---|---|---|
| Day 1 | Solvent Standards (Average, n= 7) | 76.5 |
| 500 ng/g spikes | 76.1, 75.3, 76.9 | |
| 100 ng/g spikes | 75.4, 75.5, 75.0, 84.4, 74.9 | |
| 50 ng/g spikes | 79.1, 78.6, 77.7 | |
| End Spikes (500, 100, 50 ng/g) | 76.6, 77.3, 78.5, 77.9, 79.9 | |
| Day 2 | Standards (Average, n= 6) | 73.9 |
| 25 ng/g spikes | 72.5, 82.7, 83.0 | |
| 10 ng/g spikes | 73.3, 81.5, 82.5 | |
| End Spikes (25, 10 ng/g) | 80.1, 80.7 |
![lib4396a[1]](/media/76800/download) 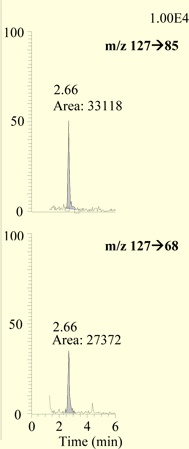 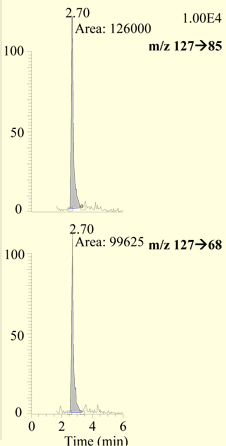 |
REFERENCES
- "LC-MS/MS Method for the Analysis of Melamine in Porcine Meat Tissue" California Health and Food Safety Laboratory, University of California at Davis http://www.cahfs.ucdavis.edu, posted 4/30/2007.